top of page
Corrinne Kang's
Portfolio
Marketing Stats
All data is pulled out from the analytics section of the e-commerce provider, based on the period of 1 Jul 2020 to 31 Oct 2021. Actual numbers may be higher as not 100% of the links used were UTM-tagged.
Overall: Print & Digital Marketing
-
Press advertisements (from QR code)
-
Electronic direct mailer (EDM), from UTM-tagged links
-
Social media, from UTM-tagged links
E-commerce sessions driven by overall marketing =
E-commerce sales driven by overall marketing =
15.88%
6.11%
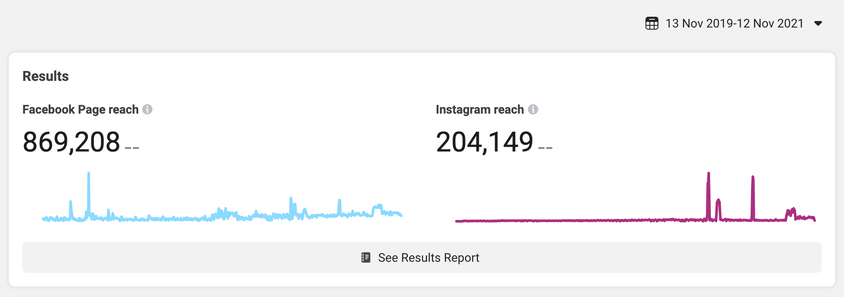
Social Media Marketing
-
From the e-commerce provider's data on sessions and sales attributed to marketing
-
Referral source = Social
E-commerce sessions driven by social media =
E-commerce sales driven by social media =
6.09%
4.46%

bottom of page


